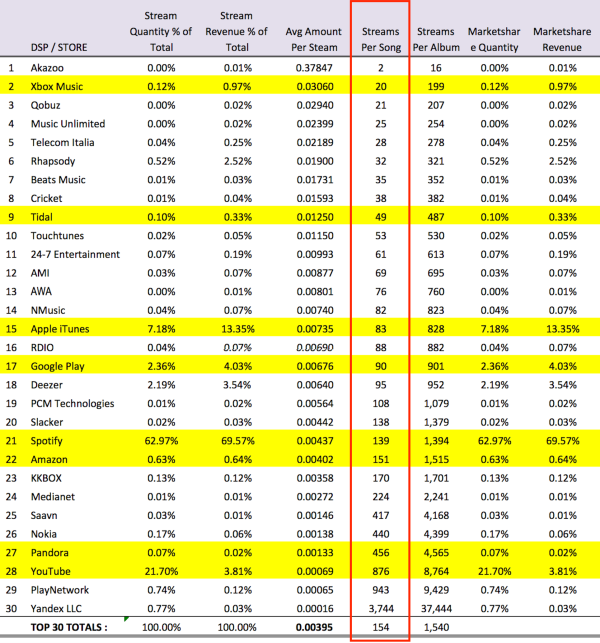
Given the controversy around streaming rates, it’s important to have some idea of what these numbers actually are. Here David Lowery shares his per stream rates across various platforms and see how the numbers shifted in 2016.
_____________________
Guest post from David Lowery of Cracker and The Trichordist
The last time we did this was back in 2014, so we thought it was time for an update. Not a lot of surprises but as we predicted when streaming numbers grow, the per stream rate will drop. This data set is isolated to the calendar year 2016 and represents an indie label with an approximately 150 album catalog generating over 115m streams. That’s a pretty good sample size. All rates are gross before distribution fees.
Spotify was paying .00521 back in 2014, two years later the aggregate net average per play has dropped to .00437 a reduction of 16%.
YouTube now has their licensed, subscription service (formerly YouTube Red?) represented in these numbers as opposed to the Artist Channel and Content ID numbers we used last time. Just looking at the new YouTube subscription service numbers isolated here, they generate over 21% of all licensed audio streams, but less than 4% of revenue! By comparison Apple Music generates 7% of all streams and 13% of revenue.
Speaking of Apple, they sit in the sweet spot generating the second largest amount of streaming revenue with a per stream rate .00735, nearly double what Spotify is paying. But, Spotify has a near monopoly on streaming market share dominating 63% of all streams and 69% of all streaming revenue. The top 10 streamers account for 99% of all streaming revenue.

To put this list in the context of our 2014 numbers we’re adding the chart below with the data sorted by the quantity of streaming plays required to match the revenue of a single song or album download. This is important as we work towards defining and setting a fair per stream rate and also setting an accurate economic equivalent of streams to songs and albums for the purposes of charting.
Billboard currently calculates 1,500 streams to one album for the purposes of charting, which at current streaming rates actually matches an economic equivalent. However, that is most likely a highly excessive numbers of plays to achieve that economic equivalent. But, more on that later…
Keep in mind every streaming service has a key piece of data that would allow artists and labels to set a fair per stream rate. Every on demand streaming service, Apple, Spotify, Tidal, Google Play all know how many times a song is played (per person) on average over time. This is the data that is key to setting fair streaming rates. Who will share this information? Apple, Jimmy Iovine, we’re looking at you.

- HOW WE CALCULATED THE STREAMS PER SONG / ALBUM RATE:
- As streaming services only pay master royalties (to labels) and not publishing, the publishing has to be deducted from the master share to arrive at the comparable cost per song/album.
- $.99 Song is $.70 wholesale after 30% fee. Deduct 1 full stat mechanical at $.091 = $.609 per song.
- Multiply the above by 10x’s and you get the album equivalent of $6.09 per album